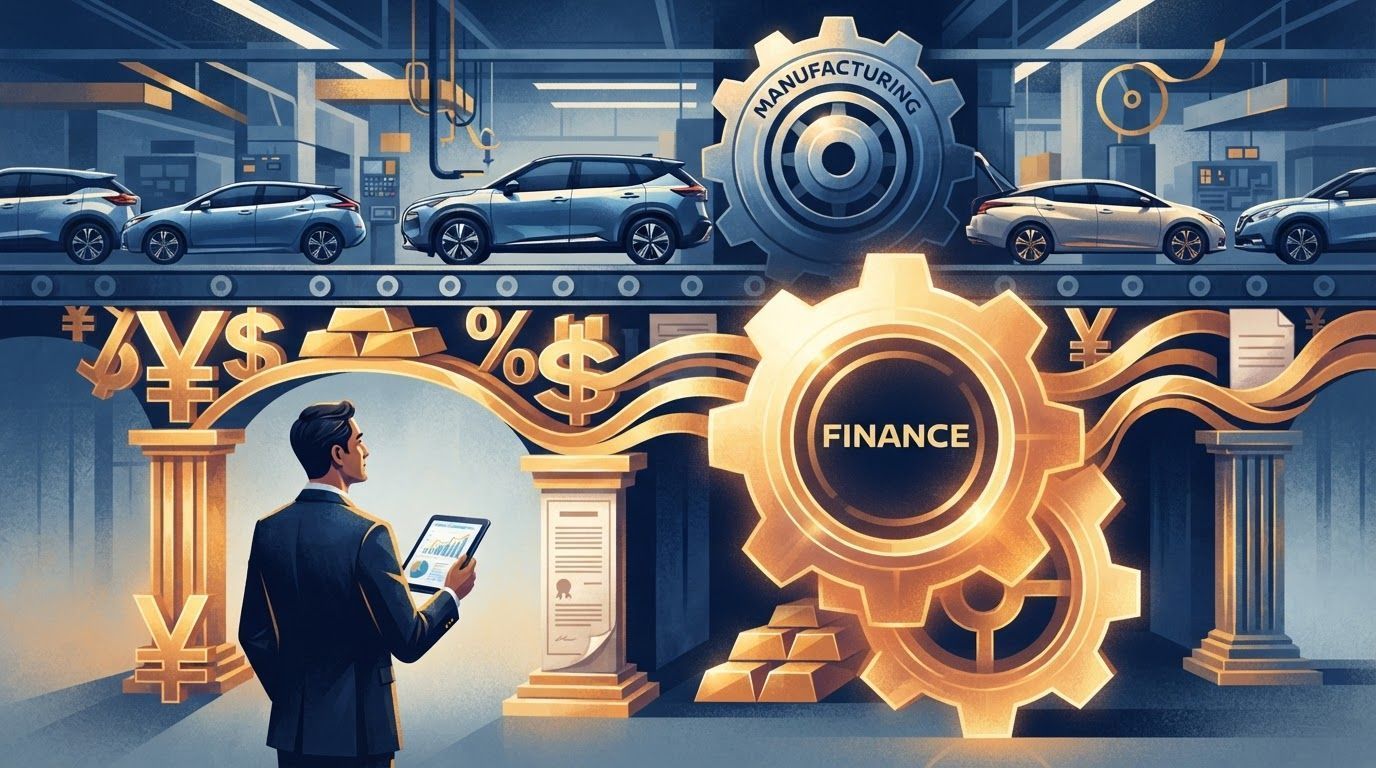
Nissan's profit engine is sales finance, not cars: six years above the car business and 54% of fiscal 2023 operating profit. But weak sales, used-car prices or credit can reverse it. Finance buys time, not a recovery.
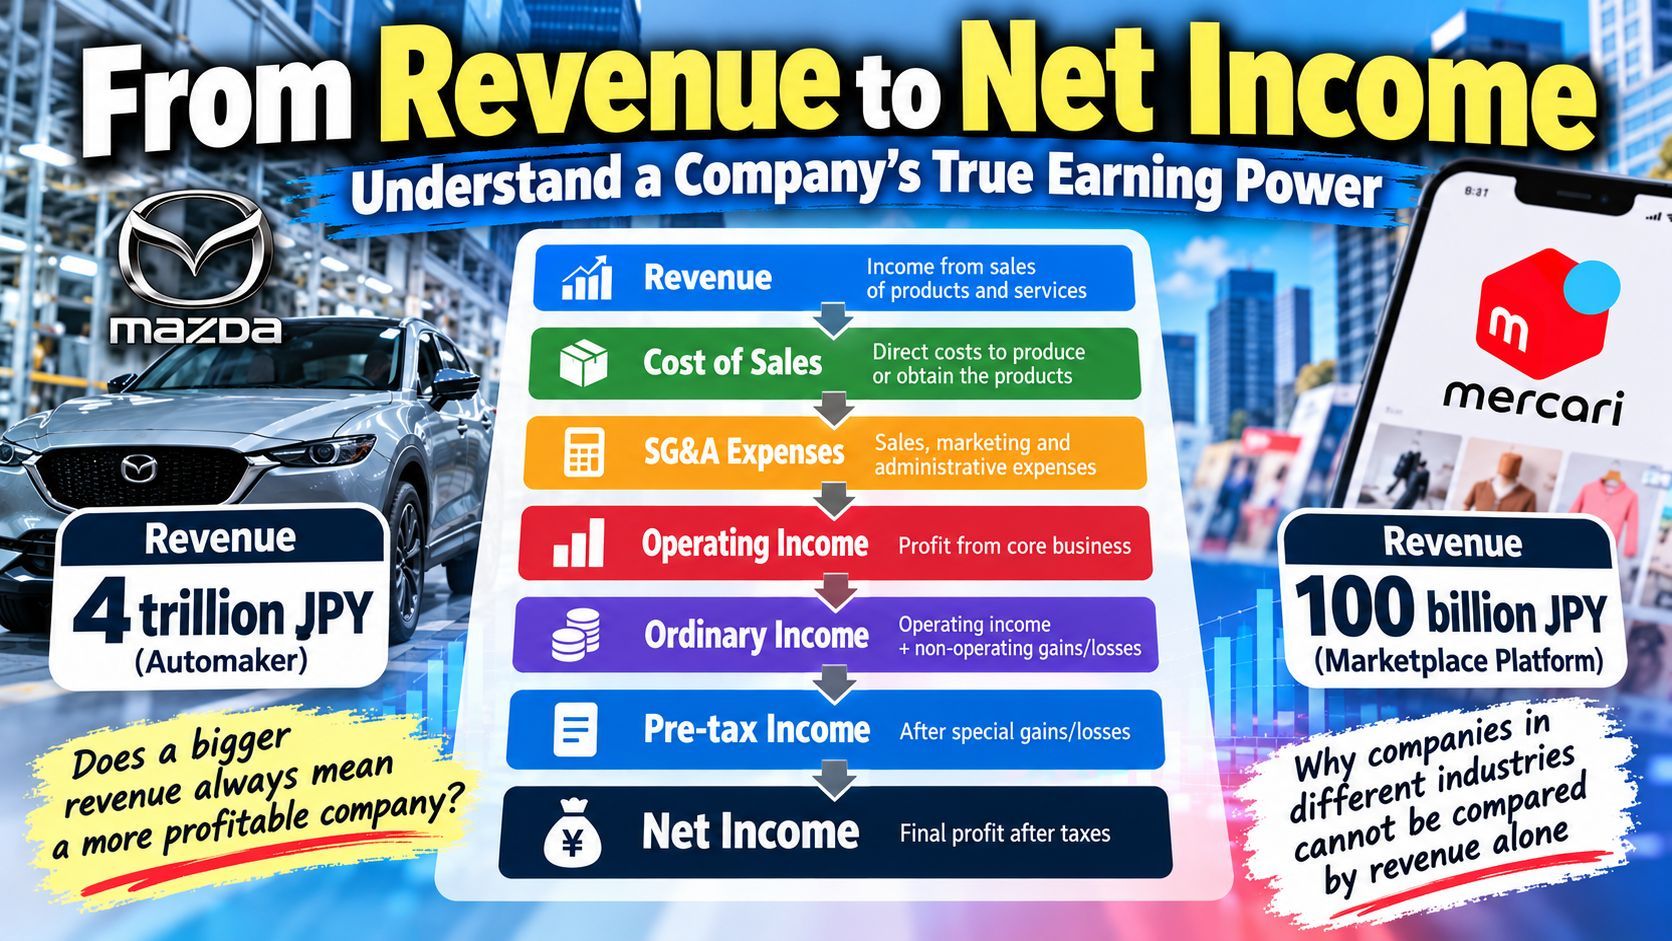
Higher revenue does not necessarily mean stronger earning power. This article moves from revenue, cost of sales, and SG&A down to operating profit, then through the five profit layers of the income statement: gross profit, operating profit, ordinary profit, pre-tax profit, and net income. Using Mazda and Mercari, it explains the gross-versus-net revenue distinction, along with gross margin, restaurant FL cost, why industries emphasize different profit measures, and how EBIT and EBITDA work. The lesson: compare companies by understanding the business model and accounting basis behind each number.
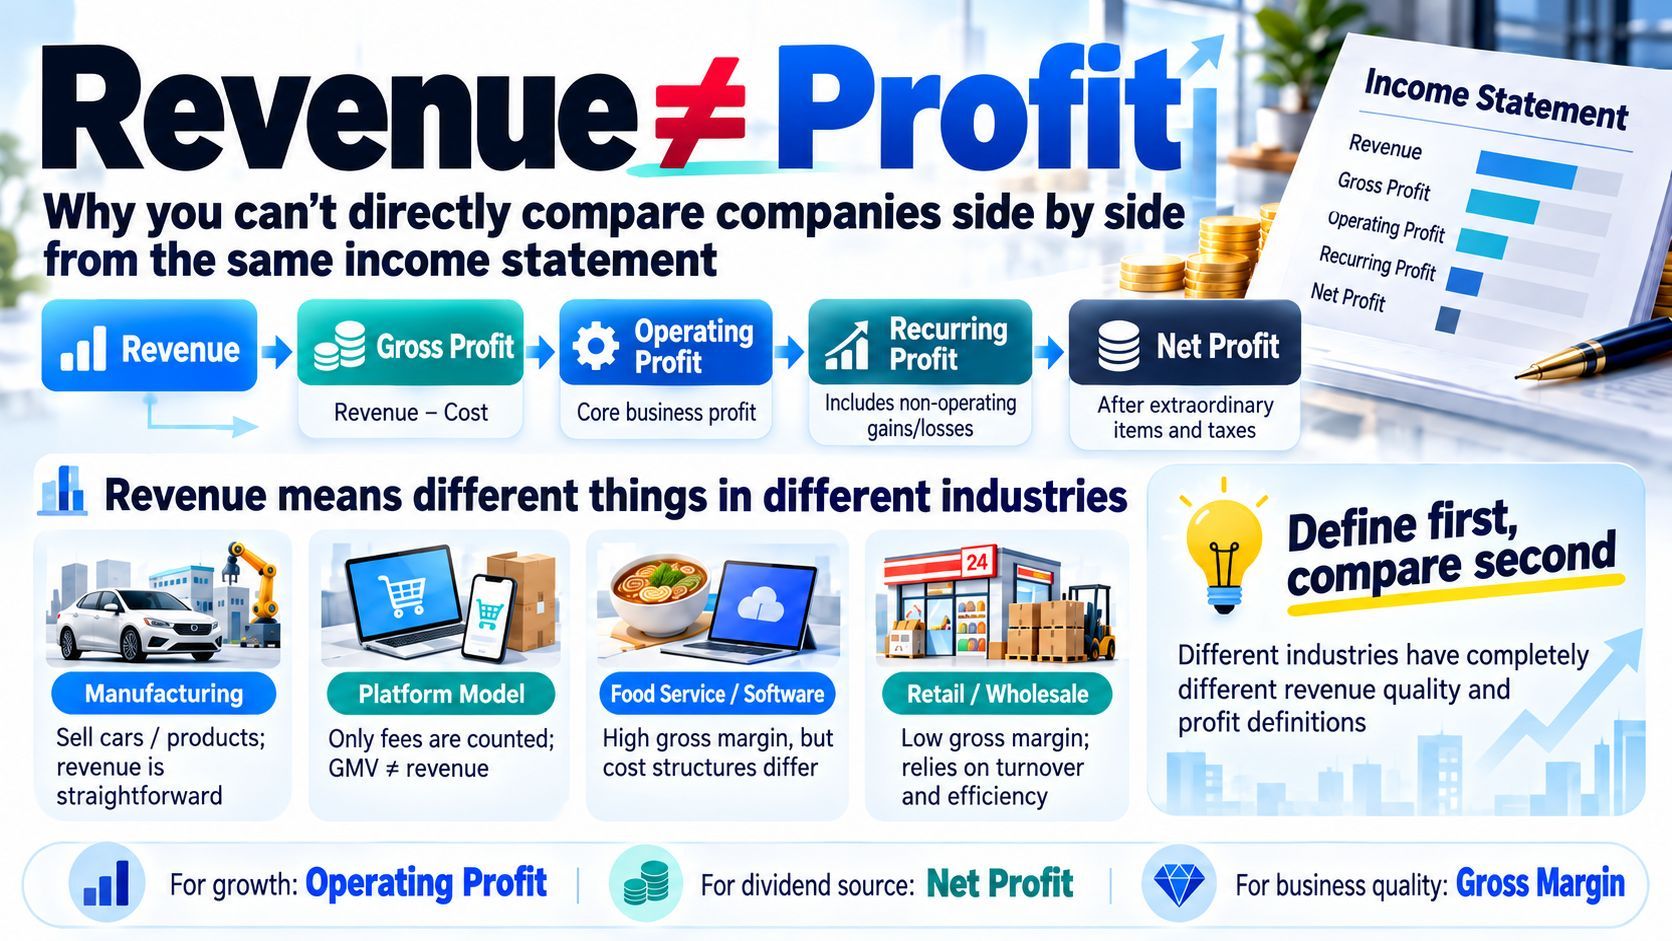
Revenue and profit are the go-to numbers for comparing companies, yet how they are calculated differs sharply by industry and by company. Using manufacturing as an example, this article walks through the ladder from revenue, cost of goods sold, and SG&A to operating profit, ordinary profit, and net profit. It then shows how much revenue can differ in substance, from Mercari booking only its roughly 10 percent commission to construction's revenue recognition and the unpredictable earnings of securities and game companies. It explains the three sources of high gross margins and why trading companies watch net profit, Nippon Yusen watches ordinary profit, and SoftBank Group watches NAV, along with business profit, EBITDA, and EBIT.