
Reading Revenue and Profit: Why Two Income Statements Can't Be Compared at Face Value
Revenue and profit are the go-to numbers for comparing companies, yet how they are calculated differs sharply by industry and by company. Using manufacturing as an example, this article walks through the ladder from revenue, cost of goods sold, and SG&A to operating profit, ordinary profit, and net profit. It then shows how much revenue can differ in substance, from Mercari booking only its roughly 10 percent commission to construction's revenue recognition and the unpredictable earnings of securities and game companies. It explains the three sources of high gross margins and why trading companies watch net profit, Nippon Yusen watches ordinary profit, and SoftBank Group watches NAV, along with business profit, EBITDA, and EBIT.

Reading Revenue and Profit: Why Two Income Statements Can't Be Compared at Face Value
When you compare two companies, the handiest yardsticks are usually revenue and profit. But how those two numbers are calculated differs completely from one industry—and one company—to the next. Compare them without checking the definitions first, and what you get is mostly an illusion. What you really need to grasp is how "revenue" and "profit" are each defined, and which metric a given company should actually be judged on.
From Revenue to Net Profit: The Steps of the Income Statement
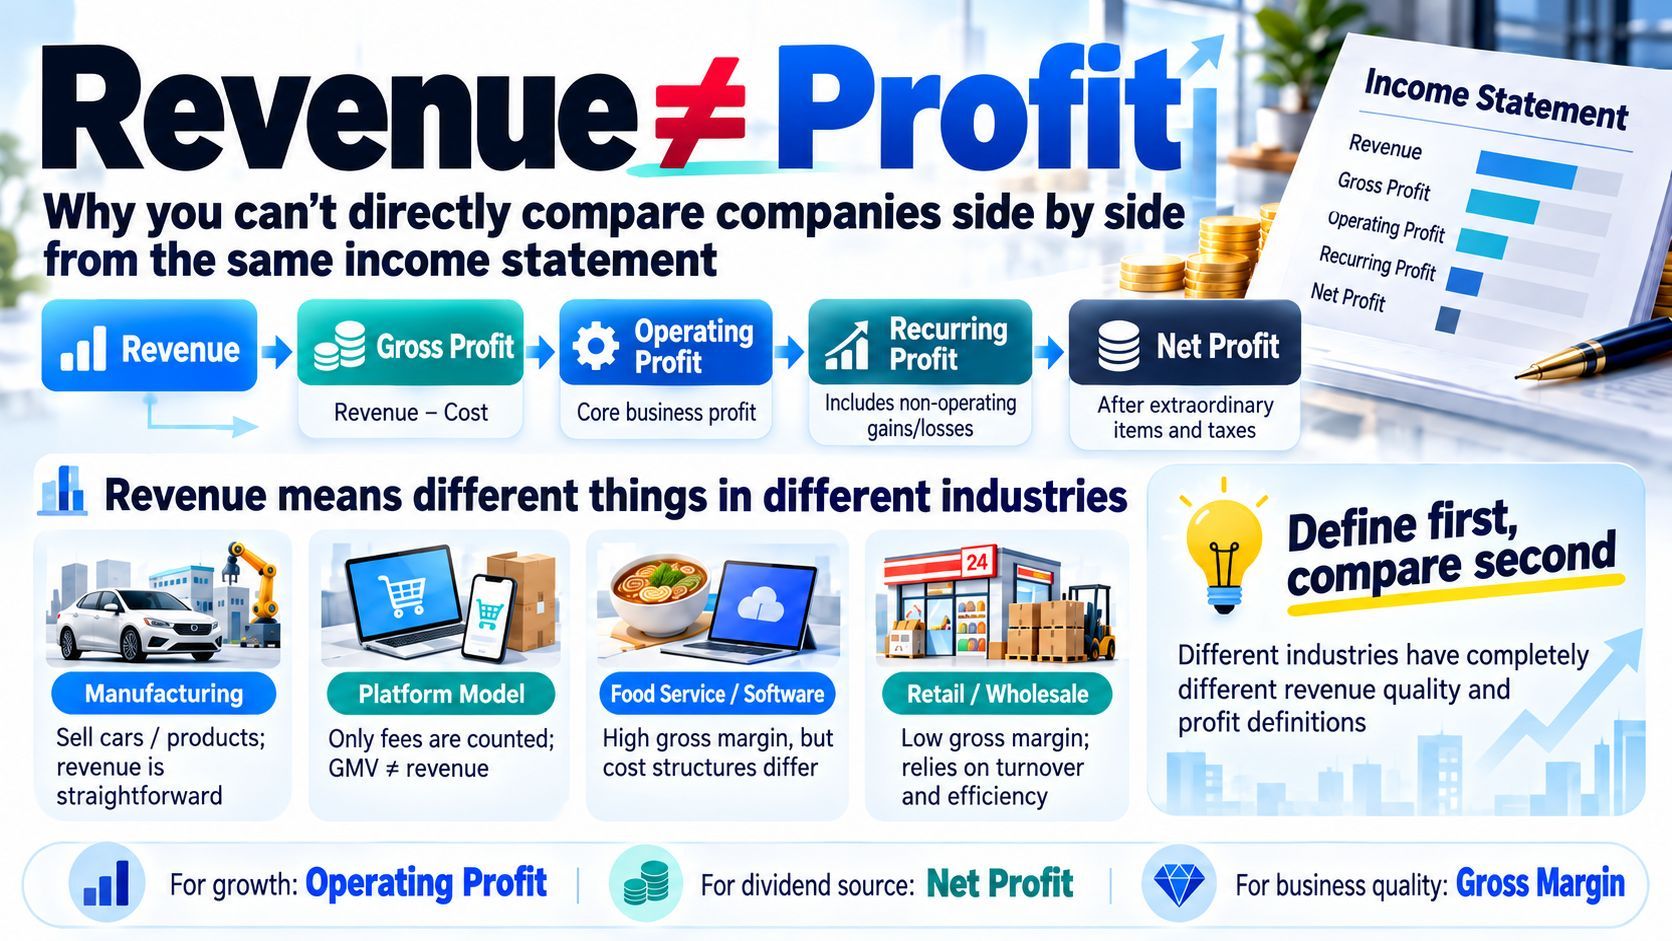
Revenue is the amount of money a company brought in for the products and services it sold during a given period, usually one year. To generate revenue, you first need products, goods, or services. Take manufacturing. To make a product you need a factory, processing equipment, materials, and wages for the people working on the floor—the costs of producing goods, known as the cost of goods sold. On top of that come the pay of sales staff, advertising and promotion expenses, the personnel costs of indirect departments such as HR, general affairs, and accounting, and the rent on head office space. These are selling, general and administrative expenses.
Subtract the cost of goods sold and SG&A from revenue, and you get operating profit. Operating profit matters because it is, quite literally, the earnings from the core business, and it is the easiest metric to read: how much it grew versus the previous period tells you about growth, and its ratio to revenue tells you how efficiently the company is earning.
Moving further down, adding gains and losses from outside the core business to operating profit gives you ordinary profit—items such as interest on bank loans, dividends from investments, and rental income from real estate. Subtract one-off items from ordinary profit—special gains like the sale of a factory, or special losses such as restructuring charges—along with taxes, and what remains is net profit. Net profit is the source of dividends; whatever is left after paying shareholders accumulates on the balance sheet as retained earnings.
What "Revenue" Actually Contains Varies by Industry
Anyone who has covered companies for a living feels this point keenly. New reporters who joined Toyo Keizai were typically assigned industries such as automobiles, toiletries, or precision machinery, and wrote for the Company Quarterly Report, the Weekly Toyo Keizai, and Toyo Keizai Online. These industries were handed to newcomers because for cars and toiletries, unit sales translate almost directly into revenue, and subtracting purchasing and manufacturing costs leaves profit—making the trend in earnings relatively easy to read.
Take Mazda. Oversimplified to the extreme, it is "how many cars at what price did we sell?" There are plenty of variables—whether the volume sellers are the compact Mazda2 or the large Mazda CX-80 SUV, or how many units go out under another brand through OEM deals—but the mechanism that produces revenue does not change. Costs work the same way: purchasing materials and parts, assembly costs, production efficiency, foreign exchange, quality. They fluctuate, but they are basically items whose movement is easy to follow.
Change the industry, though, and the content of revenue departs sharply from intuition. Mercari, which runs a flea-market app, has gross merchandise volume of more than one trillion yen on its marketplace, yet the marketplace business reports revenue of only about one hundred billion yen. The reason is that it counts only the roughly 10 percent commission it collects from sellers as revenue. If a company like Amazon or Askul handled everything from purchasing to sales itself, the full sale amount would become revenue. The same scale of transaction activity can produce revenue that differs by an order of magnitude.
Construction recognizes income in yet another way: revenue and costs are recognized according to how far the work has progressed—the revenue recognition standard, formerly called the percentage-of-completion method. Finish a project under budget and ahead of schedule, and profit rises; let the schedule stretch out or material prices spike, and earnings deteriorate sharply. Material price trends can be judged from the market, but the progress and profitability of each individual project are hard for an outsider to grasp.
Securities firms move with trading activity in the stock market, and whether a game company's new release becomes a hit is impossible to predict unless it belongs to a very famous series. Because reasonable estimates are so difficult, quite a few of these companies simply do not disclose earnings drivers.
Gross Margin: A Ruler for the Quality of a Business
Revenue minus the cost of goods sold gives gross profit. Gross profit matters because the higher the ratio of gross profit to revenue—the gross margin—the lower the cost of goods sold and the higher the value added of the business. There are three patterns behind this.
The first comes from a company's own competitiveness. Firms like Keyence and OBIC post gross margins and operating margins clearly above their peers: where peers earn operating margins of around 10 percent, both of these companies exceed 50 percent. They have sharpened the competitiveness of their products and services through their own efforts, and as a result capture high value added.
The second comes from industry structure. In content businesses such as software, games, music, and publishing, the same product can be used by many users, and the cost of copying it is extremely low. A company holding a hit therefore has a low cost ratio and a high gross margin. Marketing spending comes first and can mean losses early on, but this model pairs extremely well with subscriptions and freemium. Restaurants are another high-gross-margin category, at roughly 60 to 70 percent, because the food and drink they serve is kept to about 30 to 40 percent of the price. The trade-off is heavy labor costs for chefs and service staff, which leaves operating margins low. The industry calls the combination of food cost and labor cost "FL cost," with roughly 65 percent considered the appropriate level. At the directly operated stores of McDonald's Holdings Company (Japan), materials are 38.1 percent and labor is 26.5 percent—64.6 percent in total, almost exactly on the 65 percent line.
The third is the reverse: industries that are structurally low-margin. Retail and wholesale have a naturally high purchasing ratio, so gross margins run low. These businesses try every trick in the book—product development, assortment, and sales methods—to lift profitability, but supermarkets still earn margins of about 4 percent and specialized trading companies about 2 percent, which is very low.
Which Profit to Watch: Different Companies Value Different Metrics
Operating profit represents the earnings of the core business, but it excludes gains and losses from non-core operations, one-off special items, and taxes. Toyo Keizai, the publisher of the source materials, treats operating profit as the most important metric in its Company Quarterly Report and its industry map. And yet the metric a company or industry emphasizes can differ.
General trading companies value net profit. With investments spread across a wide range of businesses, the dividends they receive are large; deal-making is active; and special gains and losses swing sharply. Under those conditions, net profit is the better lens.
The shipping giant Nippon Yusen is another example. Freight rates soared during the pandemic, and the earnings of Ocean Network Express Holdings (ONE), an equity-method affiliate in which it holds a 38 percent stake, expanded dramatically. For the fiscal years ended March 2022 and March 2023, Nippon Yusen booked 700 billion to 800 billion yen in equity-method investment gains; operating profit was in the 200 billion yen range, while ordinary profit exceeded one trillion yen. ONE is not a consolidated subsidiary of Nippon Yusen, but it is one of its important investments.
SoftBank Group, meanwhile, values NAV—net asset value, effectively net assets—calculated by subtracting net debt, such as borrowings, from the shares it holds. After transforming into an investment company, its earnings swing widely with changes in the valuation of its holdings and with sales. Emphasizing NAV is how it communicates how much value it holds.
Some companies use metrics such as business profit, EBITDA, or EBIT. The definition of business profit varies by company, but it often includes equity-method investment gains and losses and impairment or sale gains on businesses, while excluding financial expenses. EBITDA is earnings before interest, taxes, depreciation, and amortization—net profit plus taxes, depreciation and amortization, and interest paid. EBIT is earnings before interest and taxes, which in the same calculation does not include depreciation and amortization. Because these two metrics exclude the depreciation and taxes tied to capital investment, they are seen as measures of pure earning power and are popular in finance, including M&A.
Whether it is revenue, profit under one definition or another, or the single metric a company puts first, the premise of comparing businesses is understanding what each number contains. Revenue and profit are the common language—but the ruler only becomes usable once you understand how they are actually generated in a specific industry and a specific company.