
From Revenue to Net Income: How to Read a Company's Earning Power
Higher revenue does not necessarily mean stronger earning power. This article moves from revenue, cost of sales, and SG&A down to operating profit, then through the five profit layers of the income statement: gross profit, operating profit, ordinary profit, pre-tax profit, and net income. Using Mazda and Mercari, it explains the gross-versus-net revenue distinction, along with gross margin, restaurant FL cost, why industries emphasize different profit measures, and how EBIT and EBITDA work. The lesson: compare companies by understanding the business model and accounting basis behind each number.

From Revenue to Net Income: How to Really Read a Company's Ability to Make Money
Start with a set of numbers that are easy to misread.
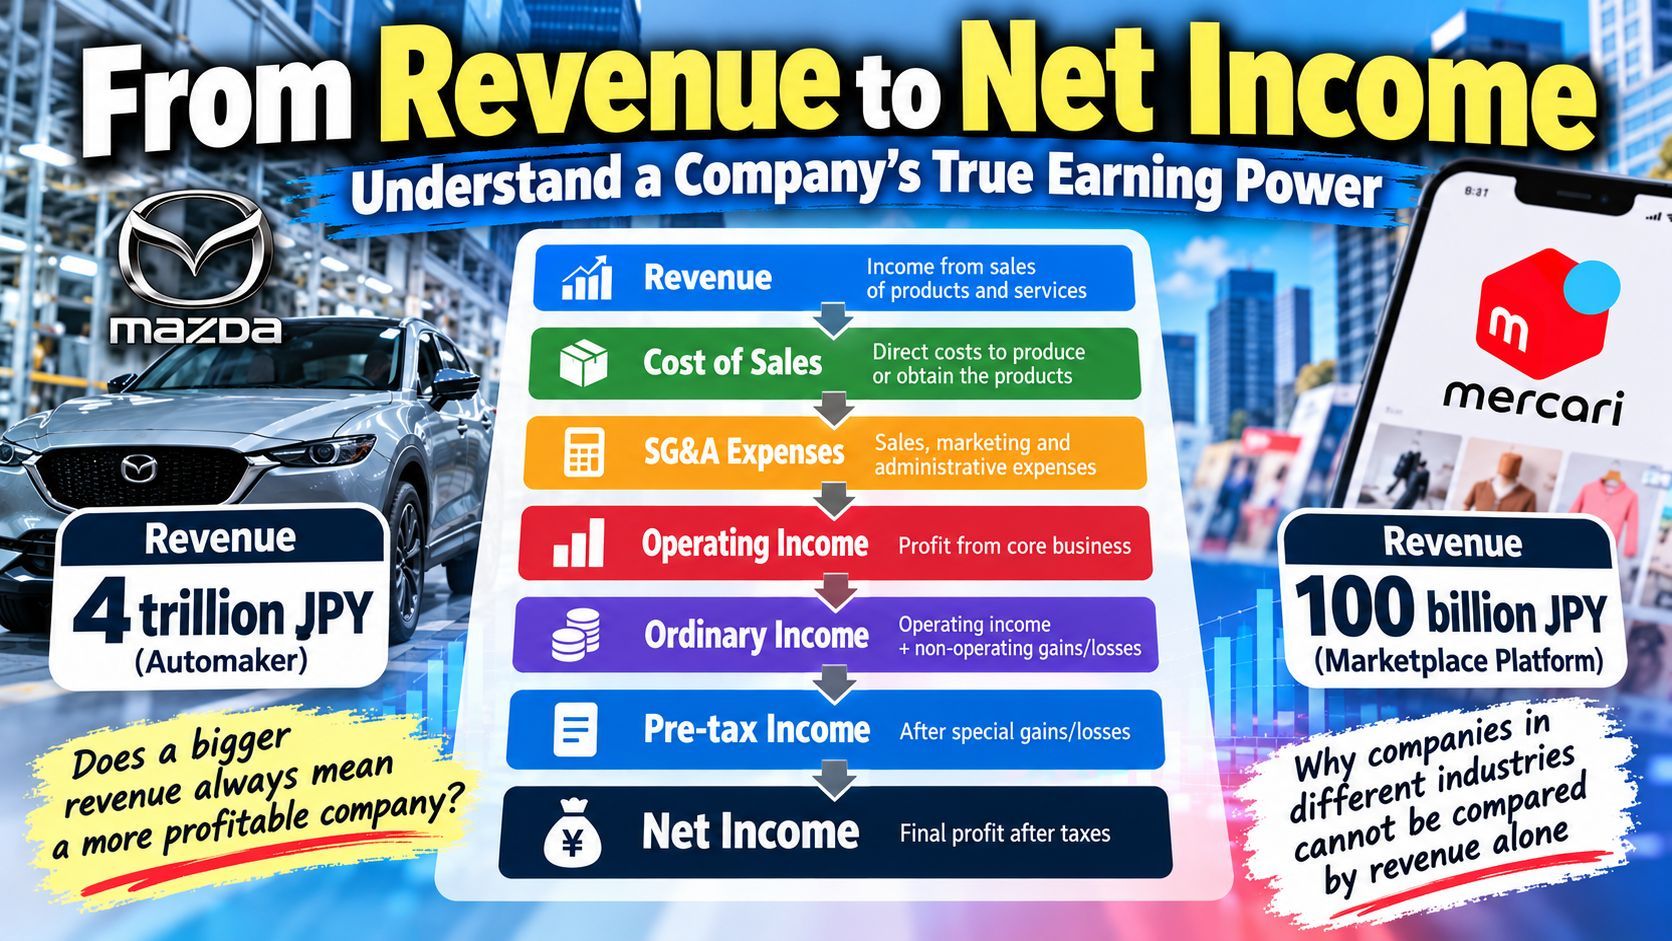
A carmaker reports annual revenue of 4 trillion yen. An internet company reports 100 billion yen. The first is 40 times larger than the second. Does that mean it is 40 times better at making money?
Of course not. Revenue is only the scale of a company's top line, not the profit it keeps. And profit itself comes in several layers. Companies differ completely in how they recognize revenue, how their costs are structured, and how their business models work. Put two companies' revenue side by side and compare the raw size, and you can easily reach the opposite conclusion.
That is the question this article sets out to answer: from revenue down to net income, how exactly does a company's money get retained step by step? Once you understand that chain, you can look at Mazda, Mercari, McDonald's Japan, Nippon Yusen, SoftBank Group, or even Google and Amazon, and tell which numbers reflect the scale of the business, which reflect profitability, which reflect investment value, and which are merely temporary accounting results.
1. Revenue Is Not Profit
Revenue (売上高) is the income a company recognizes during a given period from selling goods or providing services.
Take the most everyday example. You open a coffee shop in Japan. You sell 100 cups a day at 500 yen each and operate 300 days a year. Then:
100 cups × 500 yen × 300 days = 15,000,000 yen
That 15 million yen is the coffee shop's revenue.
But one point matters enormously: revenue does not mean the owner made 15 million yen. To sell that coffee you have to buy beans, milk, and paper cups, and pay staff wages, rent, and utilities. Only what is left after those costs can become profit.
There is a subtler distinction, too: revenue is accounting income, and it does not necessarily equal cash already received. Sales on credit also create revenue — the goods have shipped and the income has been recognized, but the money has not arrived yet. This is a point I will come back to again and again: profit and cash are two different things.
2. Revenue, Cost of Sales, SG&A, and Operating Profit
To see how profit is retained, you first need to separate three concepts.
Cost of sales (売上原価) is the cost directly incurred, or allocated under accounting rules, to produce or acquire the goods and services already sold. In manufacturing, it typically includes the raw materials needed to make the product, depreciation of factory equipment, wages of production workers, and factory operating costs related to production.
Note, however, that not every company classifies the same expenditures as cost of sales. Cost categories can differ from company to company and industry to industry.
Suppose a factory makes an appliance that sells for 100,000 yen at a production cost of 60,000 yen. Then:
100,000 − 60,000 = 40,000 yen
That 40,000 yen is gross profit.
SG&A (販管費), short for selling, general and administrative expenses, covers sales staff salaries, advertising, head-office rent, the cost of HR, finance, and legal departments, and head-office administration. These expenses are not necessarily used directly to make the product, but they are essential to keeping the company running.
Take the same appliance: a selling price of 100,000 yen, a production cost of 60,000 yen, and 20,000 yen of allocated SG&A. Then:
100,000 − 60,000 − 20,000 = 20,000 yen
That 20,000 yen is operating profit. At this point we have the single most important formula in business:
Revenue − Cost of sales − SG&A = Operating profit
3. The Five Profit Layers on the Income Statement
Japanese income statements most commonly show five profit layers. Take a company with annual revenue of 100 million yen (figures in the table are in ten-thousands of yen):
| Layer | Item | Amount |
|---|---|---|
| — | Revenue | 10,000 |
| — | Less: Cost of sales | 6,000 |
| ① | Gross profit | 4,000 |
| — | Less: SG&A | 2,500 |
| ② | Operating profit | 1,500 |
| — | Plus: Non-operating income | 200 |
| — | Less: Non-operating expenses | 300 |
| ③ | Ordinary profit | 1,400 |
| — | Plus: Extraordinary gains | 400 |
| — | Less: Extraordinary losses | 500 |
| ④ | Pre-tax profit | 1,300 |
| — | Less: Income taxes, etc. | 400 |
| ⑤ | Net income | 900 |
All figures above are teaching assumptions. The pre-tax profit layer is included to show the full calculation of net income.
① Gross profit (売上総利益)
Gross profit = Revenue − Cost of sales
It measures whether the product itself makes money. Suppose two companies each sell 10 million yen of goods:
| Metric | Company A | Company B |
|---|---|---|
| Revenue | 10 million | 10 million |
| Cost of sales | 8 million | 3 million |
| Gross profit | 2 million | 7 million |
| Gross margin | 20% | 70% |
Company B's gross margin is far higher than Company A's. That may suggest B's products command stronger pricing power, a cost advantage, or differentiated value. But it does not mean B is necessarily more profitable — it may still have to pay enormous advertising, R&D, or administrative costs.
② Operating profit (営業利益)
Operating profit = Gross profit − SG&A
Operating profit measures how much a company actually earns from its core business after bearing its day-to-day operating costs.
Suppose a software company has gross profit of 70 million yen but spends 65 million yen selling software, developing products, and running the company, leaving only 5 million yen of operating profit. A manufacturer has gross profit of only 30 million yen but SG&A of just 10 million yen, so its operating profit reaches 20 million yen.
This shows that a high gross margin does not guarantee a high operating margin. Operating profit is usually the better lens on the performance of a company's core business.
③ Ordinary profit (経常利益)
Ordinary profit is a distinctive feature of Japanese financial statements.
Ordinary profit = Operating profit + Non-operating income − Non-operating expenses
Non-operating income may include interest income, dividend income, and certain foreign-exchange gains. Non-operating expenses may include interest on bank loans, certain foreign-exchange losses, and other non-core but recurring costs.
For example, a company has operating profit of 10 million yen, bank loan interest of 3 million yen, and dividend income of 1 million yen. Ordinary profit is:
10 + 1 − 3 = 8 million yen
Operating profit shows how the core business performed; ordinary profit goes further and reflects a company's recurring earnings, including its financial income and expenses.
Note that ordinary profit is a common concept in the Japanese accounting system. Not every set of financial statements under international standards includes this standard profit layer.
④ Extraordinary gains, extraordinary losses, and pre-tax profit
Extraordinary gains (特別利益) are items that meet certain classification criteria, such as a gain on the sale of a fixed asset. Extraordinary losses (特別損失) include certain major asset disposal losses, impairments, or restructuring losses.
Suppose a company runs normally and earns 10 million yen, but sells a factory that year and books an extraordinary gain of 30 million yen. Pre-tax profit for the year may jump sharply. But you cannot conclude that the core business suddenly became stronger, because the factory sale may not repeat next year. When analyzing a company, then, you must separate sustainable operating profit from one-off gains.
⑤ Net income (純利益)
Net income is the accounting profit left after deducting relevant expenses, extraordinary items, and income taxes. Put simply, it is how much book profit a company ultimately kept after calculating all gains and losses and taxes for the year.
But a common misunderstanding needs correcting here: net income is not the cash left in the bank account. A company may have receivables, inventory, depreciation, and unpaid expenses. Nor is net income the same as money that can all be paid out to shareholders; whether to pay a dividend also depends on cash flow, distributable profit, legal rules, and management decisions.
4. Why Revenue Cannot Be Compared Directly: Mazda vs. Mercari
This is a key step in understanding company comparisons. Look at two cases.
Mazda is a carmaker, and it typically earns revenue by selling automobiles and related products and services. The data used here comes from part of Mazda's fiscal year ending March 2024: about 1.059 million units shipped, an estimated average price of about 3.61 million yen, and revenue of about 3,826.8 billion yen.
Mazda's income comes mainly from selling cars and similar products, so unit volumes and average selling prices are an important entry point for understanding its revenue. Still, actual financial revenue is also affected by product mix, parts, services, and the timing of revenue recognition. You should not assume that all revenue is strictly unit volume times average price.
Mercari is a secondhand marketplace that mainly earns platform revenue by matching individuals' used-goods transactions and charging a fee. The data used here comes from Mercari's platform business for the fiscal year ending June 2024: gross merchandise value (GMV) of about 1,072.7 billion yen and, at roughly a 10% fee, platform revenue of about 107.2 billion yen.
Here two completely different numbers appear:
- Gross merchandise value: the value of goods transacted between buyers and sellers on the platform.
- Platform revenue: what Mercari recognizes as revenue under its recognition rules, mainly the fees it receives.
For example, suppose you sell a used laptop for 100,000 yen on Mercari and the fee is 10%. The transaction the platform facilitated is worth 100,000 yen, but the fee income the platform earns from it is only 10,000 yen. The other 90,000 yen belongs to the seller, not to Mercari as revenue.
So why can these two revenue figures not be compared directly? Because the two companies' business models are fundamentally different.
| Item | Mazda | Mercari |
|---|---|---|
| Business model | Manufacture and sell cars | Match buyers and sellers |
| Main revenue source | Sales of cars and related products | Platform fees, etc. |
| Revenue basis | Usually recognizes product sales | Mainly recognizes service fees |
| Main cost profile | Raw materials, factories, production equipment | Systems, people, marketing, etc. |
| What revenue represents | Income from products and services the company sells | Income from services the platform provides |
This brings in an important accounting concept: the gross method versus the net method. In accounting, whether a company is the principal or an agent in a transaction can determine whether revenue is recognized on the gross value of the goods or the net value of the commission. But the test is not simply whether the company holds inventory; it also depends on specific facts such as whether it controls the goods or services and what responsibilities it bears.
Take the same 100,000-yen laptop. If a retailer sells it as principal, it may recognize 100,000 yen of revenue. If a platform merely brokers the deal and takes a 10% fee, it may recognize only 10,000 yen of income.
So: a company with large revenue has not necessarily created more profit, and a company with small revenue does not necessarily have lower economic value. This is a crucial foundation for understanding the differences among internet platforms, retailers, software companies, and carmakers.
5. What Gross Margin Really Tells You
Gross profit is an amount; gross margin is a ratio:
Gross margin = Gross profit ÷ Revenue × 100%
For example, Company A has revenue of 10 billion yen and gross profit of 2 billion yen, a 20% gross margin. Company B has revenue of 3 billion yen and gross profit of 2.1 billion yen, a 70% gross margin. Even though B's revenue is less than a third of A's, B's gross profit is higher. This shows that for every unit of revenue B generates, it retains a higher proportion to cover other operating costs and form profit.
Why do software companies tend to have high gross margins?
Suppose you develop a piece of software and spend 50 million yen on initial R&D. Once it is finished, you offer customers a cloud service. Adding one more customer may require only a little more server capacity, bandwidth, and customer support. As the customer base grows, revenue can grow faster than direct service costs — one reason software companies often have high gross margins.
But software companies still need substantial R&D staff, sales and marketing, security and compliance investment, infrastructure operations, and customer support. So a high gross margin in software does not mean the operating margin is necessarily high. Keyence and OBIC, mentioned in the book, are also examples of companies that built strong profitability through high added value, product differentiation, and their business model.
Gross margins in restaurants can also be high — and this is where beginners often get confused.
Suppose a restaurant has revenue of 1 million yen and food costs of 350,000 yen. Gross margin is:
(100 − 35) ÷ 100 = 65%
That looks very high. But the restaurant also has to pay staff wages, rent, and utilities, so even with a 65% gross margin, the operating margin may be only 5% or even lower.
The book lists the historical cost structures of three Japanese restaurant companies: McDonald's Japan HD at about 9.8% "profit", Kura Sushi at about 0.3%, and Hiday Hidaka at about 9.5%. The figures come from the financial periods listed in the book; here "profit" is the gross-profit concept the book uses to illustrate cost structure, not net income. Reporting periods differ across the companies, and cost classifications may differ too, so this should not be treated as a strictly uniform apples-to-apples ranking.
The restaurant industry has another very important concept: FL cost.
- F = Food, the cost of ingredients.
- L = Labor, the cost of staffing.
FL cost ratio = (Food cost + Labor cost) ÷ Revenue × 100%
Using the historical data for McDonald's Japan HD's company-owned stores as given in the book:
38.1% + 26.5% = 64.6%
In other words, for every 100 yen of revenue, about 64.6 yen goes to food and labor. The remaining 35.4 yen is not net profit; it still has to cover other operating costs. The book notes that the restaurant industry often treats an FL cost ratio of around 65% as a reference level. But that is only a rule of thumb, not a standard that applies to every restaurant. Fast food, izakaya, fine dining, and delivery restaurants can have markedly different sensible cost structures.
Wholesale and retail tend to have lower gross margins.
Retailers usually buy goods from suppliers and resell them to consumers. For example, a supermarket buys a bottle of drink for 90 yen and sells it for 100 yen, for a gross profit of only 10 yen, a gross margin of 10 ÷ 100 = 10%. This kind of business usually needs large sales volume, fast turnover, and fine-grained cost management to make a profit. The book notes that some supermarkets may have profit margins of around 4% and specialized trading companies around 2%. But here you must distinguish gross margin from operating margin: these lower margins usually refer to operating-level and final business-profit measures, not the product gross margin discussed earlier.
So does a higher gross margin mean a better company?
Not necessarily. A supermarket may have a gross margin of only 20% but turn its goods over 20 times a year. A high-end furniture store may have a 60% gross margin but turn its inventory only once a year. The supermarket earns little per transaction but can create substantial annual profit and cash flow through high turnover.
Analyzing a company therefore also requires looking at sales scale, operating margin, inventory turnover, capital investment, and cash flow.
6. Why Different Industries Care About Different Profit Measures
Companies create economic value in different ways, so they focus on different profit measures.
Manufacturers usually focus on operating profit. Car, machinery, and electronics makers need to keep producing and selling products, and operating profit reflects their core profitability fairly directly. But analysis cannot ignore R&D, capital expenditure, asset impairment, or exchange-rate effects.
General trading companies may focus more on net income. Japan's general trading houses — Mitsubishi Corporation, Itochu, and Mitsui & Co., for example — do not just trade goods; they also invest in mines, energy, infrastructure, food, and retail, and some of those investees are not wholly owned subsidiaries. As a result, an important part of their earnings may come from the profits of affiliated companies, investment income, equity-method gains and losses, and gains on share sales. Looking only at operating profit could miss important economic results from their investment businesses. When analyzing Japanese trading houses, it is often necessary to look at net income attributable to owners of the parent.
Why can Nippon Yusen's ordinary profit exceed its operating profit? Nippon Yusen (日本郵船) holds a stake in Ocean Network Express (ONE), and ONE is not an ordinary wholly owned subsidiary. According to the book, in the historical results for the fiscal years ended March 2022 and March 2023, Nippon Yusen earned very large equity-method investment income from ONE. This produced a seemingly strange phenomenon: operating profit of only about 200 billion yen, while ordinary profit could exceed 1 trillion yen. The reason was not that operating profit from the core shipping business suddenly multiplied; it was that investment income from an affiliate entered the calculation of ordinary profit. That is why you cannot look at a single profit number.
Investment-type companies may focus on NAV. The book uses SoftBank Group as an example. SoftBank Group holds large equity stakes in many companies, and analyzing a company like this may require looking at NAV — net asset value:
NAV = Value of assets held − Related liabilities
For example, an investment company holds stakes in three companies with estimated values of 50 billion yen (Company A), 30 billion yen (Company B), and 20 billion yen (Company C), for a total of 100 billion yen. Subtract related net debt of 40 billion yen, and NAV is 60 billion yen.
But note: NAV is not the profit earned in the year, nor is it simply a synonym for book net assets on the balance sheet. NAV may use market prices or valuations of the equity held, so it changes with the market. The marketability of the assets, taxes, ownership structure, and debt allocation also affect its real economic value.
7. EBIT and EBITDA
These two measures are a little more technical, but well worth mastering.
EBIT stands for Earnings Before Interest and Taxes. It can be understood as profit before deducting interest and income taxes. A common simplified formula is:
EBIT ≈ Pre-tax profit + Interest expense
It is mainly used to reduce the effect of financing structure and income-tax differences on profitability comparisons. However, the exact definition of EBIT can vary by company and by analyst.
EBITDA stands for Earnings Before Interest, Taxes, Depreciation and Amortization. A common simplified formula is:
EBITDA ≈ EBIT + Depreciation + Amortization
Why add back depreciation and amortization? Because they are accounting expenses and are usually not cash paid out in the current period.
For example, a factory buys a machine for 100 million yen and expects to use it for 10 years. Under simple straight-line depreciation with no residual value, the annual depreciation expense is 10 million yen. But that does not mean the factory actually pays another 10 million yen each year to buy machines. So some analyses add depreciation back to profit to see earnings before these non-cash expenses.
The difference between the two can be summarized like this:
| Measure | Deducts depreciation and amortization? | Main use |
|---|---|---|
| EBIT | Yes | Look at earnings before interest and taxes |
| EBITDA | No | Look at earnings before depreciation and amortization |
For example, a factory has EBIT of 20 million yen, depreciation of 10 million yen, and amortization of 2 million yen that year. Then EBITDA = 20 + 10 + 2 = 32 million yen. EBITDA looks considerably higher than EBIT.
But remember: EBITDA is absolutely not cash flow. It does not directly deduct the capital expenditure a company makes to buy new equipment, nor does it reflect all the cash effects of changes in inventory and receivables, interest, and taxes. For a business that must constantly buy machines and upgrade equipment, looking at EBITDA alone can overstate the cash it can truly use freely. That is why you cannot look only at EBITDA when analyzing manufacturers, data centers, or telecom operators.
8. Putting the Method to Work: Comparing Three Companies
Imagine three companies: Company A is a carmaker, Company B is a SaaS software business, and Company C is an e-commerce platform. Their financial data is as follows (in billions of yen):
| Metric | A (Cars) | B (Software) | C (Platform) |
|---|---|---|---|
| Revenue | 1000 | 200 | 100 |
| Cost of sales | 800 | 40 | 20 |
| Gross profit | 200 | 160 | 80 |
| SG&A | 150 | 110 | 50 |
| Operating profit | 50 | 50 | 30 |
| Gross margin | 20% | 80% | 80% |
| Operating margin | 5% | 25% | 30% |
By revenue alone, A is the largest, B second, and C the smallest. By operating profit, A and B are equal at 5 billion yen. By operating margin, C is highest at 30%.
Should we immediately conclude that C is the best? Still no. You also need to ask: Does the company have room to keep growing? How much capital does it take to earn these profits? Is its cash flow healthy? Is its debt too high? Do the profits depend on one-off factors? And are the companies' revenue-recognition bases comparable?
So a profit margin is an important starting point for understanding company quality, not a final verdict.
9. Run the Numbers Yourself — It Beats Memorizing Formulas
The most effective way to understand these concepts is to move the numbers yourself.
Picture a simple profit simulator, in units of ten-thousands of yen: revenue 1000, cost of sales 600, SG&A 250. Then gross profit is 400 and the gross margin is 40.0%; operating profit is 150 and the operating margin is 15.0%. This means the business is currently profitable — but note that this is not yet net income after non-operating items, extraordinary items, and taxes.
You can try a few variations:
- Raise revenue without raising costs, and watch how profit grows.
- Raise revenue while sharply increasing SG&A, and see whether profit actually grows.
- Keep revenue flat, lower cost of sales, and watch how the gross margin and operating margin change.
These experiments help you understand why companies want to raise prices, control costs, and improve operating efficiency.
10. A Checklist for Reading Japanese Corporate Financial Results
When you read the earnings materials of listed Japanese companies from now on, work through them in this order:
- Confirm the business model: Does the company make money by selling goods, providing services, charging fees, or holding equity?
- Confirm the revenue basis: Is revenue recognized on a gross or net basis? Are there other scale metrics such as GMV?
- Look at gross profit and gross margin: After deducting direct costs from revenue, how much is left?
- Look at the operating margin: After bearing day-to-day operating costs, how much profit remains from the core business?
- Check ordinary profit and net income: Are there investment gains, interest, extraordinary items, or tax factors?
- Check cash flow and the balance sheet: Can book profit convert into cash? Is the company over-indebted?
- Compare with peers and history: Compare at least the past three years' trend and confirm whether the accounting basis is consistent.
11. The Terms to Remember, and Six Layers of Thinking
First, remember these ten terms:
| Japanese | Chinese | Core meaning |
|---|---|---|
| 売上高 | 销售额 | How much revenue was recognized |
| 売上原価 | 销售成本 | The cost of goods or services sold |
| 粗利益/売上総利益 | 毛利润 | Revenue minus cost of sales |
| 販管費 | 销售管理费 | Selling and administrative expenses |
| 営業利益 | 营业利润 | Profit from the core business |
| 経常利益 | 经常利润 | Profit including recurring non-operating items |
| 純利益 | 净利润 | Profit after all gains, losses, and taxes |
| 粗利率 | 毛利率 | Gross profit as a share of revenue |
| 営業利益率 | 营业利润率 | Operating profit as a share of revenue |
| EBITDA | 息税折旧摊销前利润 | Earnings excluding interest, taxes, depreciation, and amortization |
Two more terms are worth remembering separately: GMV (gross merchandise value) and NAV (net asset value). They are not profit measures, but ways of looking at platform scale and the value of investment-type companies from different angles.
On the surface, this material is about financial terminology. In practice, it teaches a way of thinking about companies:
- Layer one: How much did the company sell? Look at revenue.
- Layer two: How profitable is the product itself? Look at gross profit and gross margin.
- Layer three: How much can the core business ultimately earn? Look at operating profit and operating margin.
- Layer four: How do financing, investing, and non-core activities affect profit? Look at ordinary profit and non-operating income and expenses.
- Layer five: How much profit did the company ultimately recognize? Look at net income.
- Layer six: Can that profit persist, convert into cash, and justify the capital invested? You also need the cash flow statement, balance sheet, return on capital, and business model.
The one line most worth remembering is this: Comparing companies is not simply comparing the size of numbers; it starts with understanding the business model, accounting basis, and economic meaning behind each number.
Once you have that principle, when you look at the financial data of Mazda, Mercari, McDonald's, Nippon Yusen, SoftBank Group, or even companies connected to Google, Amazon, and OpenAI, you can begin to tell which numbers reflect business scale, which reflect profitability, which reflect investment value, and which are merely temporary accounting results.