

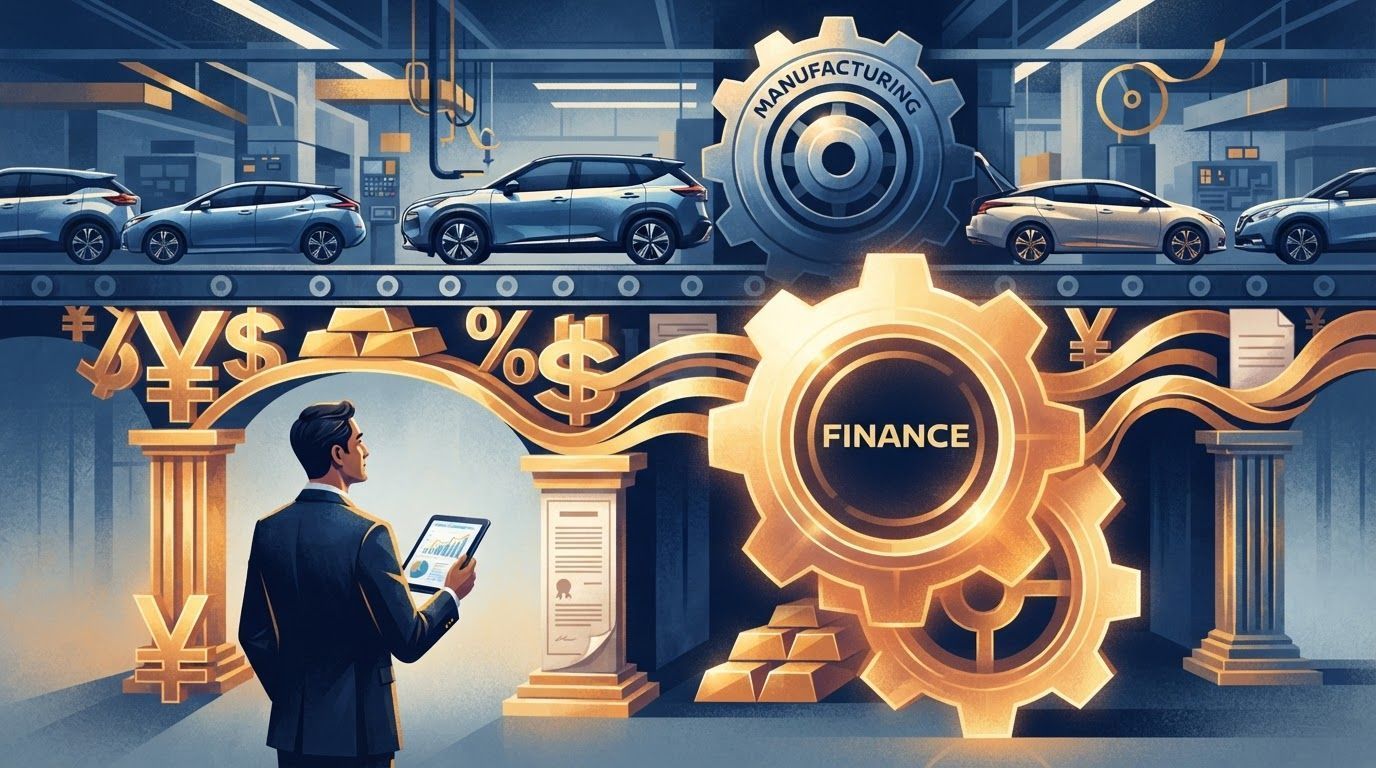
Nissan's Profit Engine Isn't Making Cars: How Sales Finance Holds Up the Business
Open the income statement: two curves moving in opposite directions
Open Nissan Motor's consolidated accounts and you find only two reportable segments: automobiles, which develops, builds and sells new vehicles, and sales finance, which lends to buyers and dealers and leases vehicles to fleets. The first is a classic manufacturing-and-sales model. It sinks money into plants, tooling and research before a car is sold, and revenue moves with volume. The second is a stock business. Once a contract is signed, interest and lease payments arrive for years. 2
The two reportable segments in fiscal 2023 (year ended March 2024) 2 1
| Item | Automobiles | Sales finance |
|---|---|---|
| Revenue | ¥11.58 trillion | ¥1.10 trillion |
| Operating profit | ¥221.6 billion | ¥308.7 billion |
| Operating margin | about 1.9% | about 28.0% |
| Share of consolidated operating profit | about 39% | about 54% |
In fiscal 2023, the car business earned ¥221.6 billion of operating profit; sales finance earned ¥308.7 billion. The finance segment supplied about 54% of Nissan's ¥568.7 billion consolidated operating profit. The business that carries the company's name brought in most of the revenue but less than 40% of the profit. A segment with less than a tenth of revenue produced more than half the profit. 2
Why does the consolidated total hide this structure? 2 Consolidated operating profit is a single number: automobiles plus sales finance plus inter-segment eliminations. In fiscal 2023 the two segments added up to roughly ¥530.3 billion; eliminations and adjustments lifted the total to ¥568.7 billion. Looking only at the total hides two things at once: how thin the core was and how thick the finance cushion had become.
How sales finance actually makes money
Sales finance does not live on loan interest alone. When a customer pays for a car in installments, the company keeps the spread between its lending rate and its own funding cost. When a company leases a vehicle, it collects rent and later sells the car, turning the residual value into cash. Together, those streams produce a steadier cash flow than building and selling cars. 1
- Auto loans: lend to buyers and collect principal plus interest over the contract.
- Fleet leasing: lease vehicles to companies, collect monthly rent and carry residual-value risk.
- Used-car disposal: sell vehicles at lease-end or early termination; a price above book value becomes a gain.
- Funding: raise money through bonds and borrowings, and earn the difference between asset yields and funding costs. 1
Unlike the car business, sales finance does not need plants of the same scale, tooling or a huge engineering staff. But it is not capital-free: loan balances and leased vehicles absorb large amounts of money, and the real barriers are low-cost funding, credit discipline and residual-value management. Because it skips the manufacturing stage, a segment with less than a tenth of revenue can earn an operating margin near 30%. 2
What does it give customers, and what does it give Nissan? For customers, a loan turns a large one-off purchase into manageable monthly payments; a lease lowers the cost of switching cars. For Nissan, finance adds a second income stream after the sale, and payments keep arriving even when volume falls. But new contracts still depend on new-car sales. Finance does not grow on its own.
The cash-flow loop of sales finance
New-car sales create loan and lease contracts. Those contracts build a book of interest-earning assets, which produces interest, lease payments and used-car gains. Subtract funding costs and the remainder is segment profit.
flowchart LR
    sale["New-car sales"] --> contract["Loan and lease contracts"]
    contract --> asset["Interest-earning assets"]
    asset --> income["Interest, lease fees, disposal gains"]
    funding["Market funding"] --> cost["Funding cost"]
    income --> margin["Spread and fees"]
    cost --> margin
    margin --> profit["Sales finance profit"]
Six straight years above the core
Over time, sales finance looks less like a one-off winner. From fiscal 2018 through fiscal 2023, its operating profit beat the car business for six consecutive years. In fiscal 2021, when the car business lost ¥437.0 billion, sales finance still earned ¥267.9 billion. Segment profit generally stayed between ¥200 billion and ¥375 billion, making it one of the group's most reliable sources of cash. 2
Six years in which sales finance out-earned automobiles (¥ billion) 2
| Fiscal year | Automobiles operating profit | Sales finance operating profit |
|---|---|---|
| 2018 | 66.0 | 228.0 |
| 2019 | -264.2 | 210.5 |
| 2020 | -437.0 | 267.9 |
| 2021 | -155.1 | 374.8 |
| 2022 | 43.0 | 311.9 |
| 2023 | 221.6 | 308.7 |
The stability comes from stock. Selling new cars is a flow business; it can fall sharply in a downturn. Loans and leases are stock businesses; as long as contracts remain, income arrives on a set schedule. The long duration of the finance assets also acts as a short-term shock absorber. 3
Has the structure changed since those six years? 2 3 In the year ended March 2026, sales finance earned ¥297.9 billion while the car business lost ¥292.9 billion. The car business also lost ¥268.0 billion in fiscal 2024. The ¥221.6 billion profit in fiscal 2023 was a temporary recovery, not a durable one. Finance still carries the core; the core has not regained its earning power.
Still, calling sales finance the main business would be wrong. Without new-car sales there are no new loans or leases, and the stock of assets eventually runs down. Automobiles remain the core; sales finance is a supporting business. It simply happens to be the supporting business that currently earns the most. 1
Four conditions that can stall the engine
The finance segment's high margin depends on four things holding at once: new cars keep selling, used-car prices do not collapse, funding costs stay manageable, and borrowers keep paying. If one reverses, profit is squeezed. If several reverse together, the cushion thins quickly. 3
- Used-car prices fall: lease-end vehicles sell for less, disposal gains shrink, and write-downs may follow.
- New-car sales fall: fewer new loans and leases, slower growth in interest-earning assets, and eventually less interest income.
- Rates rise: funding costs reprice faster than loan yields, compressing the spread and raising payments on floating-rate contracts.
- Credit conditions worsen: unemployment or lower incomes push up delinquencies, and loan-loss provisions eat into spread income. 3
How pressure travels through sales finance
Falling new-car sales, weaker used-car prices, higher rates and worse credit each hit profit through a different channel. When they overlap, the damage compounds.
flowchart TD
    demand["New-car sales fall"] --> origin["Fewer new loans"]
    origin --> stock["Slow growth in assets"]
    stock --> interest["Interest income slows"]
    used["Used-car prices fall"] --> resale["Lower disposal gains or write-downs"]
    rate["Rates rise"] --> funding["Funding costs rise"]
    rate --> delinquency["Borrowers pay more"]
    funding --> squeeze["Spread narrows"]
    delinquency --> loss["Bad-debt losses rise"]
    interest --> pressure["Profit under pressure"]
    resale --> pressure
    squeeze --> pressure
    loss --> pressure
Why are higher rates a double-edged sword? Finance companies typically borrow short and lend long. When rates rise, funding costs reprice quickly while asset yields lag until loans are reset or replaced. The spread narrows in the meantime. Higher rates can also cool the economy and weaken borrowers' ability to repay. The transcript's two warnings, a thinner spread and more bad debt, can arrive through separate channels at the same time.
Toyota and Honda: how unusual is Nissan's dependence?
Put the three companies on the same measure and Nissan stands out. In fiscal 2023, sales finance accounted for about 54% of Nissan's consolidated operating profit, versus about 19.8% at Honda and about 10.6% at Toyota. 4 5 2
Sales finance as a share of consolidated operating profit, fiscal 2023 4 5 2
| Company | Sales finance operating profit | Consolidated operating profit | Share |
|---|---|---|---|
| Nissan | ¥308.7 billion | ¥568.7 billion | about 54% |
| Toyota | ¥570.0 billion | ¥5.35 trillion | about 10.6% |
| Honda | ¥274.0 billion | ¥1.38 trillion | about 19.8% |
This does not mean Toyota's or Honda's finance arms are weak. Their core businesses earn enough that finance looks like a supplement. At Nissan, the car business earns so little that finance has become the load-bearing wall. High dependence is not inherently bad. The problem is that the wall stands on new-car sales. The weaker the core, the shakier the foundation. 4 5 2
How were those three percentages calculated? 4 5 2 The ratio divides each company's sales-finance segment operating profit by consolidated operating profit. Nissan reports under Japanese GAAP; Toyota and Honda use IFRS. Segment definitions and eliminations are not identical, so the numbers are better read for scale and direction than for decimal-point rankings. All three use fiscal 2023, the year ended March 2024.
Selling cars also means choosing which cars
Finance can cushion the core, but it cannot replace the product. Rebuilding the car business takes more than cost cuts. Nissan has to answer which vehicles it sells, to whom, and how much each one earns.
The recording cites an internal Nissan comparison of per-vehicle profitability by category: light trucks such as SUVs and minivans earned about 20% more than the all-category average, while kei cars earned about 65% less. The direction is easy to understand. Kei cars carry low prices, intense competition and heavy regulatory cost. SUVs and minivans carry higher prices and more equipment, making fixed costs easier to recover.
Can those two percentages support a precise conclusion? Not directly. The recording is garbled here, and the original material does not clearly state the unit of comparison: operating profit per vehicle, gross profit, or return on invested capital. No public table allows a line-by-line check. The numbers are kept here as directional evidence that model mix matters, not as a precise forecast or an industry law.
That is why selling more is not the same as earning more. If the incremental volume comes from low-margin models, growth dilutes profit. If discounts rise to defend volume, per-unit economics get thinner still. Cut too many high-volume models and factory utilization and dealer confidence suffer. The trade-off between volume and high-value models remains at the center of product planning.
Turning the time bought by finance into a real recovery
Reading Nissan as a car company that makes money from finance misses the point. Sales finance looks strong because the car business earns too little. Its stability depends on new-car sales continually replenishing the contract book. Finance can buy time, but it cannot replace the core. 3
- Does the car business return to operating profit through model mix and cost improvement, rather than one-off gains?
- Is the loan and lease book still growing? If it stalls, the stock dividend from finance gradually runs out.
- Are used-car prices and funding costs deteriorating together? If so, spreads and disposal gains can shrink at the same time. 2
The danger for Nissan is not a weak finance arm. It is mistaking finance's stability for proof that the core is safe. The real turning point will be the day the car business earns a durable profit again. Until then, the brighter sales finance looks, the clearer it is that the rebuild is not finished.