
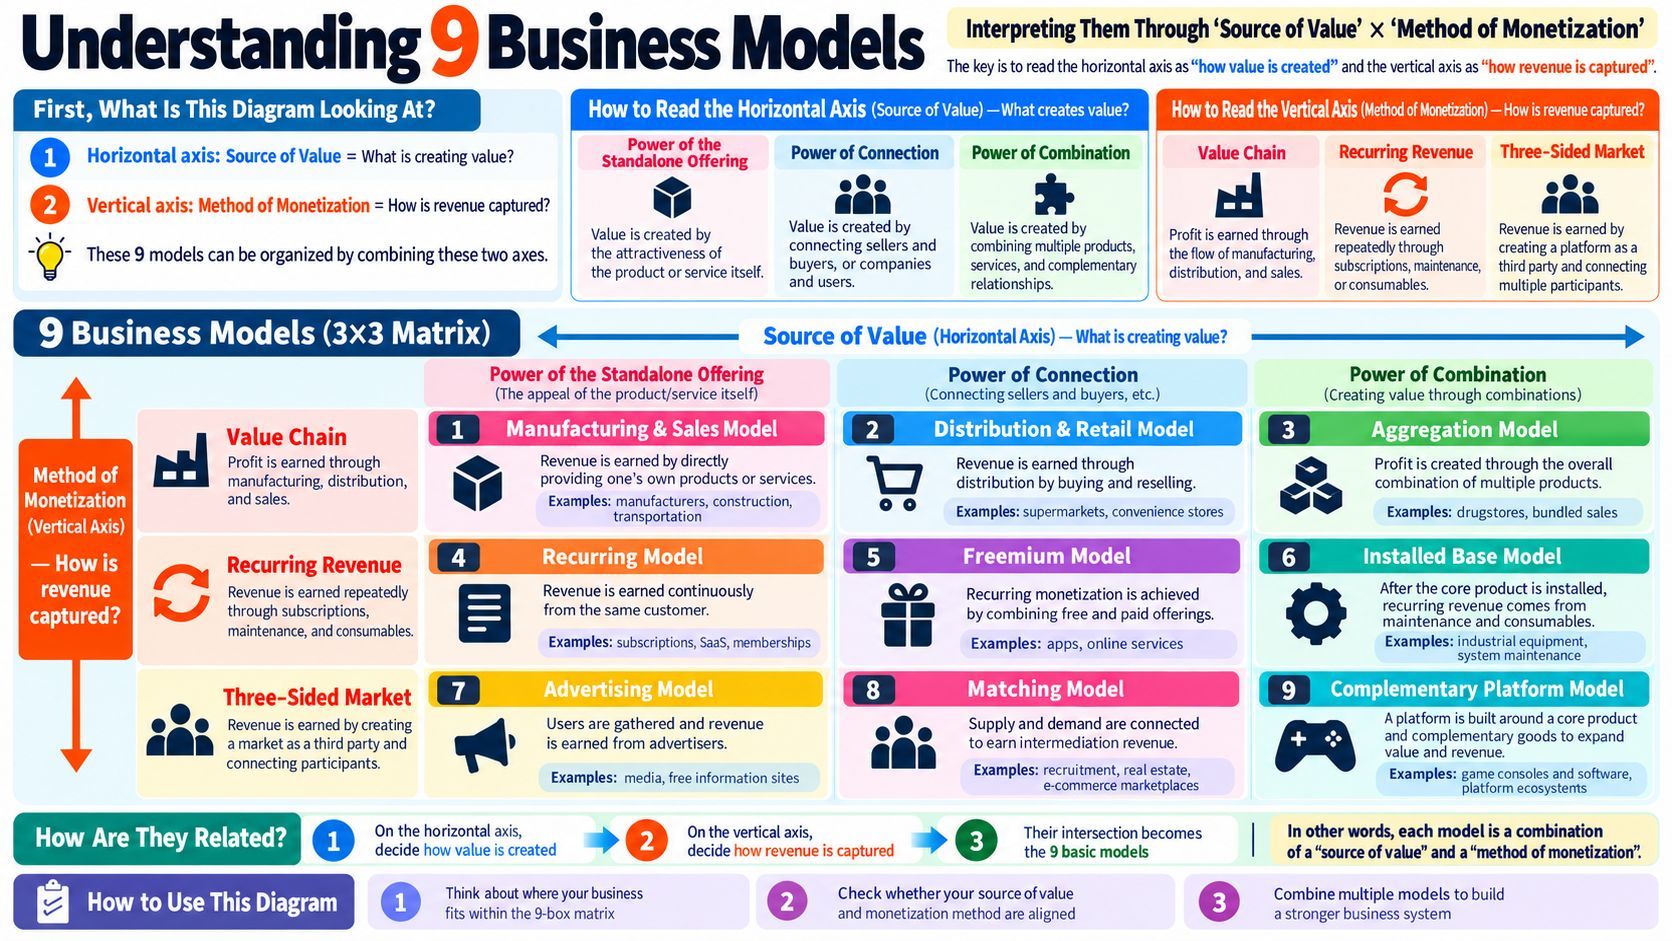
Reading 9 Business Models Through a Single Transaction Map
This article uses a single 'transaction map' to organize business models along two axes: value creation (the power of a single product, of combination, and of alliance) and revenue capture (value chain, recurring, and the three-party market). It then walks through nine models — manufacturing, distribution and retail, combination, recurring, freemium, installed base, advertising, matching, and platform — showing how even complex businesses reduce to basic moves and how the map works as a tool for reading strategy across industries.

A Framework Based on “Source of Value” × “Method of Monetization”
When people talk about business models, the discussion can quickly become confusing.
One person talks about product strength. Another talks about sales channels. Someone else talks about subscriptions, advertising, marketplaces, or platforms.
All of these are valid perspectives, but they are often mixed together.
A useful way to make the discussion clearer is to start with a simple transaction diagram.
For any business, ask two basic questions:
How is value created? How is that value monetized?
If we place these two questions on two different axes, even a complicated business can be broken down into a small number of recognizable patterns.
This framework organizes business models into a 3 × 3 matrix, creating nine basic models.
1. What Is This Diagram Actually Showing?
The key is not to memorize nine business models immediately.
First, understand the two axes.
The framework asks:
Horizontal axis: Where does the value come from? Vertical axis: How is revenue captured?
In other words, a business model can be viewed as:
Value creation method × Monetization method
This distinction is extremely useful because many business discussions become unclear when value creation and revenue generation are treated as the same thing.
They are related, but they are not identical.
A company may create value in one way and capture revenue in another.
That is exactly what this matrix helps us see.
2. How to Read the Horizontal Axis
Where Does the Value Come From?
The horizontal axis represents the source of value.
There are three basic patterns.
2.1 The Power of the Standalone Offering
The first pattern is the simplest.
The product or service itself creates the value.
Examples include:
- Automobiles
- Consumer electronics
- Construction services
- Transportation services
- Software products
Customers buy because they believe:
“This product is valuable.” “This service solves my problem.”
In this type of business, competitive advantage often comes from:
- Product quality
- Features
- Performance
- Design
- Brand
- Service quality
The value is primarily contained in the standalone product or service.
2.2 The Power of Connection
The second pattern creates value by connecting different participants.
The company does not necessarily need to manufacture the product itself.
Instead, the value comes from connecting:
people who need something with people who can provide it.
Examples include:
- Retailers
- Recruitment agencies
- Real estate brokers
- E-commerce marketplaces
- Matching services
The company creates value by reducing search costs, organizing information, building distribution channels, and making transactions easier.
The key question here is not:
“What do we produce?”
but rather:
“Who are we connecting?”
2.3 The Power of Combination
The third pattern creates value by combining multiple products, services, or complementary elements.
A single product may not generate much profit on its own.
But the overall combination may be highly profitable.
Common examples include:
- A core product + consumables
- Hardware + software
- Equipment + maintenance
- A main product + accessories
- A platform + complementary services
Examples include:
- Drugstores with carefully designed product assortments
- Printers and ink cartridges
- Industrial equipment and maintenance contracts
- Game consoles and game software
The important idea is:
Do not evaluate only one product in isolation. Evaluate the value of the whole combination.
3. How to Read the Vertical Axis
How Is Revenue Captured?
The vertical axis represents the method of monetization.
In other words:
How does the company turn value into revenue?
There are three basic patterns.
3.1 Value Chain
This is the most traditional model.
A company creates, distributes, or sells a product or service and receives payment from the customer.
The basic structure is:
Product / Service → Customer Customer → Payment
Examples include:
- Manufacturers
- Construction companies
- Supermarkets
- Convenience stores
- Logistics companies
Revenue is earned through the flow of activities such as:
- Production
- Procurement
- Distribution
- Sales
- Service
In simple terms:
Sell something and earn profit from the transaction.
3.2 Recurring Revenue
The second method is based on ongoing revenue instead of one-time revenue.
Typical examples include:
- Monthly subscriptions
- Annual subscriptions
- Membership fees
- SaaS fees
- Maintenance contracts
- Consumables
- Ongoing service fees
The core idea is to transform:
one transaction
into:
a long-term customer relationship.
Instead of asking only:
“How much profit do we make from this sale?”
the company asks:
“How much value can this customer generate over time?”
This is why recurring revenue models are often more predictable and scalable.
3.3 Three-Sided Market
The third pattern involves a company acting as a third party that creates a market or platform.
There are usually multiple participant groups.
For example, in advertising:
- Media platform
- Users
- Advertisers
In a marketplace:
- Platform
- Supply side
- Demand side
The company does not simply sell its own product directly.
Instead, it creates a place where different groups can interact and transact.
Revenue comes from enabling those interactions.
This structure is especially common in internet-based businesses.
4. How Do the 9 Business Models Fit Into the Matrix?
Once the two axes are understood, the nine models become much easier to interpret.
They are not nine completely unrelated business models.
They are combinations of:
3 sources of value × 3 monetization methods = 9 basic business models
The matrix looks like this:
| Standalone Offering | Connection | Combination | |
|---|---|---|---|
| Value Chain | 1. Manufacturing & Sales | 2. Distribution & Retail | 3. Aggregation |
| Recurring Revenue | 4. Recurring Model | 5. Freemium | 6. Installed Base |
| Three-Sided Market | 7. Advertising | 8. Matching | 9. Complementary Platform |
This is the core logic of the framework.
Each model is simply:
a way of creating value + a way of monetizing that value
5. Model 1: Manufacturing & Sales
Standalone Offering × Value Chain
This is the most basic business model.
The company produces a product or provides a service and sells it directly to the customer.
Examples include:
- Automobile manufacturers
- Component manufacturers
- Construction companies
- Transportation providers
The value comes from:
the product or service itself
The revenue comes from:
direct sales
This is the classic model of creating something valuable and selling it.
6. Model 2: Distribution & Retail
Connection × Value Chain
In this model, the company does not necessarily manufacture the product.
Its main value comes from:
connecting producers and customers.
Examples include:
- Supermarkets
- Convenience stores
- Retail chains
These businesses create value through:
- Procurement
- Distribution
- Location
- Merchandising
- Logistics
- Convenience
Their strength is making the right products available to the right customers in the right place.
The value is not only in the product.
It is also in the connection between supply and demand.
7. Model 3: Aggregation
Combination × Value Chain
The aggregation model focuses on overall profitability rather than the profit of each individual product.
For example, a drugstore may sell some products at very low margins in order to attract customers.
Once customers enter the store, they may buy other higher-margin products.
The key question becomes:
Is the total basket profitable?
rather than:
Is every individual item profitable?
Other examples include:
- Bundling
- Package sales
- Cross-selling
- Product portfolios
The value comes from the combination of multiple products or services.
8. Model 4: Recurring Model
Standalone Offering × Recurring Revenue
This model generates revenue repeatedly from the same customer.
Examples include:
- Newspaper subscriptions
- Video streaming
- SaaS
- Membership services
- Monthly service plans
The product or service itself remains the main source of value.
The difference is that the company charges repeatedly rather than only once.
The focus shifts from:
“Sell once”
to:
“Keep being used.”
9. Model 5: Freemium
Connection × Recurring Revenue
Freemium combines:
Free + Premium
The company first attracts a large number of users with a free offering.
Then a smaller percentage of those users upgrade to paid plans.
Examples include:
- Mobile apps
- Cloud services
- Online tools
- Digital platforms
- Online games
A common structure is:
- Free plan
- Professional plan
- Enterprise plan
The free version lowers the barrier to adoption.
The paid version monetizes users who need more features, capacity, or service.
The key challenge is not simply offering something for free.
It is:
converting enough free users into paying users.
10. Model 6: Installed Base
Combination × Recurring Revenue
This model is especially important in manufacturing and IT.
The company first installs or sells a core product, system, or piece of equipment.
After that, it continues to earn revenue through:
- Maintenance
- Spare parts
- Consumables
- Licenses
- Operations support
- Upgrades
Examples include:
- Industrial machinery
- Semiconductor equipment
- Printers
- Enterprise systems
- IT infrastructure
The initial sale is only the beginning.
A large portion of the long-term profit may come after installation.
That is why many industrial companies place strong emphasis on their:
installed base
or the number of products already operating at customer sites.
11. Model 7: Advertising
Standalone Offering × Three-Sided Market
Advertising businesses usually involve three groups:
- Media or platform
- Users
- Advertisers
The company attracts users with content or services.
Then it monetizes access to those users by selling advertising opportunities.
Examples include:
- Television
- News media
- Free websites
- Social media
- Content platforms
An interesting feature of this model is that:
the user and the payer may be different people.
Users consume the content.
Advertisers pay for access to user attention.
That is why advertising is a classic three-sided market model.
12. Model 8: Matching
Connection × Three-Sided Market
The matching model creates value by connecting supply and demand.
Examples include:
- Recruitment services
- Real estate platforms
- E-commerce marketplaces
- Secondhand marketplaces
- Ride-hailing
- Travel booking platforms
The company may not own the products or services being exchanged.
Its value comes from making transactions easier.
Revenue may come from:
- Commissions
- Transaction fees
- Listing fees
- Service fees
- Platform fees
These businesses often become more valuable as more participants join.
13. Model 9: Complementary Platform
Combination × Three-Sided Market
This is one of the more advanced models in the framework.
A simple example is the game console business.
A console company does not create value only by selling hardware.
It also creates an ecosystem where third-party developers can produce software.
That creates a positive cycle:
More games ↓ More attractive console ↓ More users ↓ More developers ↓ Even more games
The same logic appears in:
- Smartphones + apps
- Operating systems + software
- Cloud platforms + SaaS
- E-commerce platforms + merchant tools
The company is no longer building only a product.
It is building an ecosystem.
14. What Is the Relationship Between the Horizontal and Vertical Axes?
This is the most important part of the framework.
The two axes are not alternatives.
They answer different questions about the same business.
The horizontal axis asks:
Why does the customer perceive value?
The vertical axis asks:
How does the company capture revenue from that value?
For example, consider a SaaS product.
First, look at the horizontal axis.
If the software itself provides the main value, it is close to:
Standalone Offering
Then look at the vertical axis.
If customers pay monthly, it is:
Recurring Revenue
Therefore:
Standalone Offering × Recurring Revenue = Recurring Model
This is how each of the nine models should be read.
They are intersection points between two dimensions.
15. Real Companies Usually Use More Than One Model
This is another critical point.
The nine models are not boxes that force a company into only one category.
In reality, successful companies often combine several models.
Take Amazon, for example.
It includes:
- Direct retail → Distribution & Retail
- Marketplace → Matching
- Prime → Recurring Model
- Advertising → Advertising Model
- AWS → Recurring Model
Apple is similar:
- iPhone → Manufacturing & Sales
- AppleCare → Installed Base
- iCloud → Recurring Model
- App Store → Complementary Platform
So the more useful question is not:
“Which one business model is this company?”
Instead, ask:
“Which business models does this company combine?”
and:
“How do those models reinforce each other?”
16. A 3-Step Way to Analyze Any Business
This framework can be applied to almost any company or new business idea.
Step 1: Identify the Source of Value
Ask:
- Is the value in the product itself?
- Is it created by connecting participants?
- Is it created through a combination of products and services?
This identifies the horizontal axis.
Step 2: Identify the Monetization Method
Ask:
- Is revenue mainly one-time?
- Is it recurring?
- Is it generated through a multi-sided market?
This identifies the vertical axis.
Step 3: Find the Intersection
Combine the two answers.
That intersection tells you which of the nine models the business most closely resembles.
This approach goes deeper than simply asking:
“What does this company sell?”
17. The Framework Can Also Be Used to Design New Businesses
This framework is useful not only for analyzing existing companies.
It can also be used for business model innovation.
Suppose a manufacturing company currently operates mainly under:
Manufacturing & Sales
The structure may look like:
Produce equipment → Sell to customer → Earn one-time revenue
The next question could be:
“Can we add recurring revenue?”
Possible additions include:
- Maintenance contracts
- Consumables
- Software subscriptions
- Remote monitoring
- Data services
The business could then move toward an:
Installed Base model
The company could go even further and ask:
“Can third parties participate?”
If it opens the system to partners, developers, or service providers, it may begin to evolve toward a:
Complementary Platform model
This is why the 3 × 3 matrix is more than a classification chart.
It can also be used as a:
map for business model innovation.
18. From Selling Products to Building Ecosystems
The nine models can also be viewed as a possible path of business evolution.
Many companies start by:
selling products
Then expand into:
products + services
Then into:
recurring revenue
Then into:
connecting multiple participants
And eventually into:
platforms and ecosystems
In other words, a company may gradually move from:
one-time transactions
to:
long-term customer relationships
to:
multi-sided markets
and eventually to:
ecosystems
This is one reason platform businesses can become extremely scalable.
19. Conclusion: You Do Not Need to Memorize All 9 Models
The easiest way to understand the framework is not to memorize nine categories.
Just remember two questions:
Horizontal axis: How is value created?
and:
Vertical axis: How is revenue captured?
Then remember the formula:
3 sources of value × 3 monetization methods = 9 basic business models
The real purpose of the framework is not to label companies.
It is to help us ask better questions:
- Where is the true source of value?
- Which part of the business actually generates profit?
- Is revenue one-time or recurring?
- Can third parties participate?
- Can a single product become a broader combination?
- Can a transaction-based business evolve into a platform?
- Can multiple business models reinforce one another?
Once you start looking at companies through these questions, you stop seeing only:
“What does this company sell?”
Instead, you begin to see:
Why the company is able to create value repeatedly, and how it turns that value into profit.
That is the real power of transaction diagrams.